The g factor — Charles Spearman’s name for the common variance that runs through all cognitive tests — is the most replicated and the most contested construct in the science of human intelligence. Whenever a sufficiently varied battery of mental tests is administered to a sufficiently varied sample of people, the same statistical regularity emerges: scores on every test correlate positively with scores on every other test, and a single general factor explains a substantial share of the differences between people. g has survived 120 years of methodological scrutiny because the pattern it describes is genuinely there in the data. What it is at the level of brains and minds, and what it does and does not justify in policy, education, and selection, is a separate set of questions that the data do not settle on their own.
How Spearman discovered the positive manifold
In 1904, Spearman analyzed school-grade correlations across what looked like unrelated subjects — Latin, mathematics, music, sensory discrimination — and reported that the correlations were uniformly positive (Spearman, 1904). Children who did well in one domain tended to do well in the others. The pattern, later named the positive manifold, has since been replicated in essentially every cognitive-ability dataset analyzed for it, across cultures, age groups, and test types. Wikipedia’s g factor article describes the positive manifold as “arguably the most replicated result in all psychology,” and there is no serious empirical challenge to its existence.
Spearman extracted the structure with a technique he helped invent: factor analysis. Applied to a correlation matrix, factor analysis identifies the linear combinations of test scores that account for the most shared variance. Spearman’s two-factor model proposed that any cognitive test taps a general factor (g) shared across all tasks plus a specific factor (s) unique to that test. A century of subsequent factor-analytic work — culminating in Carroll’s (1993) survey of more than 460 datasets in Human Cognitive Abilities — confirmed that this two-factor structure was an oversimplification. Modern analyses identify a hierarchy: g at the top, broad ability factors below it, and narrow specific abilities at the bottom. But g remains the apex of every such hierarchy whenever the test battery is broad enough to extract it.
What share of cognitive variance does g explain?
g typically accounts for 40 to 50 percent of the between-individual variance in performance on a varied cognitive test battery. The exact proportion depends on which tests are included: batteries weighted toward fluid-reasoning tasks recover a larger general factor; batteries that include narrow specialized abilities (perceptual speed, motor coordination, very specific knowledge domains) recover a smaller one. The remaining variance is split between broad-ability factors (verbal, spatial, memory, processing speed) and test-specific or method-specific variance.
This 40–50% figure is one of the most stable empirical findings in differential psychology. It is large enough to anchor a meaningful general construct, small enough to leave substantial room for specific abilities, and consistent enough across studies to make g the dominant organizing variable in modern intelligence research. Deary’s (2012) Annual Review of Psychology overview synthesizes the evidence: g is real as a statistical regularity, predictively powerful, and inadequately replaced by any of the proposed alternatives.
Is g a brain property or a statistical artifact?
The most productive scientific debate around g is not whether it exists but what it represents. Three positions divide the literature.
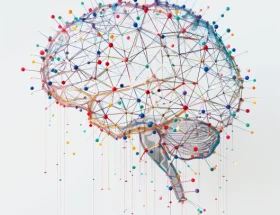
g as a network property of the brain. The Parieto-Frontal Integration Theory (P-FIT), articulated by Jung and Haier (2007) in Behavioral and Brain Sciences on the basis of 37 neuroimaging studies, proposes that g reflects the efficiency of a distributed network linking parietal and frontal cortex with supporting visual, temporal, and subcortical regions. The framework is not localizationist — there is no “intelligence center” — but it identifies a specific set of brain regions whose connectivity, white-matter integrity, and metabolic efficiency together predict performance on cognitive tests. Higher-g individuals show greater white-matter integrity (faster inter-regional communication), more efficient prefrontal activation, and somewhat larger total brain volume (correlations of about r = 0.25–0.40). The neural-efficiency angle is older still — Haier and colleagues’ 1988 PET study showed that high-g individuals used less glucose during difficult problem-solving than low-g individuals, suggesting that the brain solves the same problems with fewer resources rather than by working harder.
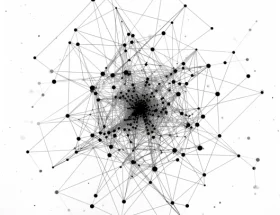
g as an emergent developmental property. Van der Maas and colleagues’ (2006) mutualism model, published in Psychological Review, offers an alternative without invoking any single neurobiological substrate. Their dynamical systems analysis showed that the positive manifold can emerge purely from reciprocal facilitation among initially independent cognitive abilities during development: as one ability strengthens, it supports growth in others through shared informational and attentional resources, and the resulting growth correlations produce a statistical general factor in the absence of any single “engine” of intelligence. The mutualism model is consistent with the fact that g emerges, with substantially the same loadings, in any sufficiently broad cognitive test battery — because what is being detected is the network correlation structure of cognitive growth, not a unitary biological entity.
g as a measurement convention. A weaker version of the constructivist position holds that g is just a description of the dominant axis in cognitive-test correlation matrices, with no privileged ontological status. Different test selections yield different general factors that are statistically similar but not identical, a point critics have used to argue against treating g as a single thing. Modern psychometrics increasingly treats this as a feature rather than a bug: g is the consistent component recovered across batteries, even if no specific battery uniquely instantiates it.
The contemporary synthesis treats P-FIT, mutualism, and the measurement view as compatible rather than competing. g is a stable statistical regularity (the measurement view is right about that), it has reproducible neuroimaging correlates organized around a parietofrontal network (P-FIT is right about that), and it likely emerges over development from reciprocal facilitation among networked cognitive abilities (the mutualism model is right about that). The neurobiology and the developmental dynamics describe the same phenomenon at different scales.
Where g sits in the cognitive-ability hierarchy
Modern intelligence research, organized around the Cattell-Horn-Carroll (CHC) framework, places g at the apex of a three-stratum hierarchy:
| Stratum | Level | Examples |
|---|---|---|
| III | General intelligence (g) — variance shared across all cognitive tasks | Extracted statistically from any sufficiently broad test battery |
| II | Broad abilities — domain-specific factors | Fluid reasoning (Gf), crystallized intelligence (Gc), short-term memory (Gsm), processing speed (Gs), visual processing (Gv) |
| I | Narrow abilities — specific skills within broad domains | Inductive reasoning, lexical knowledge, perceptual speed, spatial visualization |
Among the broad abilities, fluid reasoning (Gf) — the capacity to solve novel problems without relying on accumulated knowledge — correlates so strongly with g that some analyses report Gf-g correlations of 0.85 to 0.95. Some psychometricians treat Gf as effectively isomorphic with g; others reserve g for the higher-order factor that Gf, Gc, Gsm, Gs, and Gv all load on. The distinction matters for measurement choice — a fluid-reasoning test like Raven’s Progressive Matrices is a strong g-loaded measure, but it is not a complete g proxy because it underrepresents crystallized and working-memory variance. For more on the Gf-Gc distinction, see fluid vs. crystallized intelligence and why both matter.
How heritable is g, and what does that mean?
Twin and adoption studies converge on a finding that surprises people on first encounter: the heritability of g increases with age. In childhood, heritability estimates for general cognitive ability cluster around 40–50%, with shared family environment contributing 25–30%. By adulthood, heritability rises to 60–80%, and the shared-environment contribution shrinks toward zero. Bouchard (2013) named this counterintuitive trajectory the Wilson Effect after the developmental geneticist Ronald Wilson who first documented it.
The mechanism is not that genes “switch on” later. The current best explanation is gene-environment correlation: as people gain autonomy with age, they increasingly select environments — schools, friendships, occupations, leisure activities — that match their genetic predispositions. Genetic differences are progressively amplified by the environments they help create, while parental and household effects (the shared-environment contribution) wash out. This dynamic has implications for intervention: childhood is the window where shared environment matters most, but the trajectory toward genetic-environmental correlation is hard to reverse without sustained changes to the environments adults choose.
Molecular genetics has now begun replacing twin-study estimates with direct evidence. Plomin and Deary’s (2015) review summarized the field’s emerging consensus that intelligence is polygenic — shaped by thousands of genetic variants of small effect, not by a few “intelligence genes.” Savage and colleagues’ (2018) genome-wide association meta-analysis, drawing on 269,867 individuals, identified 205 genomic loci associated with intelligence and implicated genes involved in neural development, synaptic plasticity, and myelination. The polygenic architecture is exactly what the diffuse, network-property accounts of g would predict.
What does g actually predict?
Schmidt and Hunter’s (1998) Psychological Bulletin meta-analysis of 85 years of personnel-selection research established that general mental ability is the strongest single predictor of job performance across occupations, with validity coefficients around r = 0.51 — substantially higher than work experience (r ≈ 0.18), conscientiousness (r ≈ 0.31), or unstructured interviews (r ≈ 0.38). The advantage is largest for high-complexity jobs, where novel problem-solving and rapid information integration matter most, and smallest for routine work where procedural competence dominates.
The educational-outcome correlations are similarly strong: g predicts academic achievement at r ≈ 0.50–0.70 across countries and educational systems. The correlation is largest for novel and complex content (mathematics, abstract reasoning) and smaller for rote-memorization content where prior exposure dominates fluid ability. Income and occupational attainment correlate with g at moderate magnitudes (r ≈ 0.30–0.40 for income, r ≈ 0.40–0.50 for occupational status), with the relationship plateauing somewhat at the upper extreme of the cognitive distribution.
The most striking life-outcome finding is mortality. Calvin and colleagues’ (2017) BMJ analysis of the Scottish Mental Survey — which tested nearly every Scottish 11-year-old in 1936 and followed them for 68 years — found that higher childhood IQ predicted lower mortality from coronary heart disease, stroke, smoking-related cancers, respiratory disease, digestive disease, injury, and dementia. The effect sizes were not small: a one-standard-deviation higher childhood IQ was associated with mortality reductions in the 20–30% range across the major causes of death. The mechanism almost certainly is multifactorial — better health literacy, more effective decision-making about risk, more advantageous occupational and social trajectories — but the cumulative effect on lifespan is real and well-replicated.
The major criticisms — and what they do and do not establish
Howard Gardner’s Multiple Intelligences (1983). Gardner’s framework proposed eight or more independent “intelligences” (linguistic, logical-mathematical, spatial, musical, bodily-kinesthetic, interpersonal, intrapersonal, naturalistic). The framework has been culturally influential in education but lacks the empirical foundation of g: when Gardner’s domains are measured with standardized instruments, they correlate positively, recovering exactly the kind of general factor Gardner’s theory was designed to deny. Most psychometricians read Multiple Intelligences as a theory of valued cognitive applications and aptitudes rather than a viable structural alternative to g.
Robert Sternberg’s Triarchic Theory (1985). Sternberg argued that analytic intelligence (closest to g) is one of three components, alongside creative and practical intelligence. Empirical tests of the triarchic structure have produced mixed results: Sternberg’s own measures of practical and creative intelligence tend to correlate substantially with g, undermining the independence claim. The framework has more traction as a broadening of what cognitive instruments measure than as a refutation of g.
Reification. A philosophical concern: factor analysis is a statistical decomposition that does not, by itself, license treating the extracted factor as a thing with causal force. The mutualism model is partly a response to this concern — it shows that the positive manifold can emerge without a unitary biological substrate. The contemporary working position is to treat g as a real statistical regularity with real predictive power and reproducible neural correlates, while remaining agnostic about whether there is a single biological “g-thing” beneath the regularity.
Cultural specificity. Critics have argued that g-loaded tests reflect cognitive skills valued in Western, industrialized, educated societies. Cross-cultural studies that have explicitly tested for the positive manifold in non-WEIRD populations have generally found it, with comparable factor structure, although the test materials require adaptation. The honest summary is that g appears to be a robust feature of human cognitive variation, but the specific instruments that measure it carry cultural assumptions that affect how cleanly between-population comparisons can be made.
Frequently asked questions
What is the g factor in simple terms?
g — short for “general intelligence” — is the statistical pattern that shows up when people take many different cognitive tests: someone who does well on one tends to do well on others. The general factor extracted from this pattern accounts for about 40–50% of the variance in test performance and is the strongest single predictor of academic, occupational, and health outcomes that psychology has produced.
Is g the same as IQ?
Closely related but not identical. IQ scores from a comprehensive test battery (Wechsler, Stanford-Binet, Woodcock-Johnson) are excellent estimates of g — typically with a correlation above r = 0.90 between full-scale IQ and the extracted general factor. A single short test is a weaker proxy. The cleaner conceptual distinction is that g is the latent construct and IQ is the score on a particular standardized instrument designed to measure it.
Who discovered the g factor?
Charles Spearman, in his 1904 American Journal of Psychology paper “‘General intelligence’ objectively determined and measured,” which introduced both the empirical claim about positive correlations across cognitive tasks and the factor-analytic technique that became the standard tool for studying it.
Is g biological?
Partly. Neuroimaging consistently shows that g correlates with white-matter integrity, prefrontal-parietal connectivity, and total brain volume, and Jung and Haier’s (2007) Parieto-Frontal Integration Theory organizes these findings into a network account. The mutualism model (van der Maas et al., 2006) shows that the positive manifold can also emerge from reciprocal facilitation among cognitive abilities during development, without any single biological “engine.” Most contemporary researchers see these accounts as complementary rather than competing.
How heritable is g?
About 40–50% in childhood and 60–80% in adulthood — the increase across the lifespan is known as the Wilson Effect (Bouchard, 2013) and is best explained by gene-environment correlation: as people gain autonomy, they select environments that match their genetic predispositions, amplifying genetic influences over time. Molecular evidence (Savage et al., 2018) shows that the genetic contribution is highly polygenic, distributed across hundreds of variants of small effect.
Do alternative theories like Multiple Intelligences replace g?
No, on the empirical evidence. Gardner’s Multiple Intelligences and Sternberg’s Triarchic Theory are conceptually broader frameworks for what cognitive measurement should cover, but their proposed independent “intelligences” correlate positively when measured, recovering the same general factor they were meant to replace. They function better as expansions of the assessment range than as refutations of g.
References
- Bouchard, T. J., Jr. (2013). The Wilson Effect: The increase in heritability of IQ with age. Twin Research and Human Genetics, 16(5), 923-930. https://doi.org/10.1017/thg.2013.54
- Calvin, C. M., Batty, G. D., Der, G., Brett, C. E., Taylor, A., Pattie, A., Čukić, I., & Deary, I. J. (2017). Childhood intelligence in relation to major causes of death in 68 year follow-up: Prospective population study. BMJ, 357, j2708. https://doi.org/10.1136/bmj.j2708
- Carroll, J. B. (1993). Human Cognitive Abilities: A Survey of Factor-Analytic Studies. Cambridge University Press.
- Deary, I. J. (2012). Intelligence. Annual Review of Psychology, 63, 453-482. https://doi.org/10.1146/annurev-psych-120710-100353
- Jung, R. E., & Haier, R. J. (2007). The Parieto-Frontal Integration Theory (P-FIT) of intelligence: Converging neuroimaging evidence. Behavioral and Brain Sciences, 30(2), 135-154. https://doi.org/10.1017/S0140525X07001185
- Plomin, R., & Deary, I. J. (2015). Genetics and intelligence differences: Five special findings. Molecular Psychiatry, 20(1), 98-108. https://doi.org/10.1038/mp.2014.105
- Savage, J. E., Jansen, P. R., Stringer, S., Watanabe, K., Bryois, J., de Leeuw, C. A., et al. (2018). Genome-wide association meta-analysis in 269,867 individuals identifies new genetic and functional links to intelligence. Nature Genetics, 50(7), 912-919. https://doi.org/10.1038/s41588-018-0152-6
- Schmidt, F. L., & Hunter, J. E. (1998). The validity and utility of selection methods in personnel psychology: Practical and theoretical implications of 85 years of research findings. Psychological Bulletin, 124(2), 262-274. https://doi.org/10.1037/0033-2909.124.2.262
- Spearman, C. (1904). “General intelligence,” objectively determined and measured. The American Journal of Psychology, 15(2), 201-292. https://doi.org/10.2307/1412107
- van der Maas, H. L. J., Dolan, C. V., Grasman, R. P. P. P., Wicherts, J. M., Huizenga, H. M., & Raijmakers, M. E. J. (2006). A dynamical model of general intelligence: The positive manifold of intelligence by mutualism. Psychological Review, 113(4), 842-861. https://doi.org/10.1037/0033-295X.113.4.842
Related Research
Does Music Training Increase IQ?
Few claims in popular science have been as durable as the idea that music makes you smarter. The 1990s "Mozart Effect" sent pregnant women rushing…
Apr 15, 2026Working Memory: Why It Matters
Working memory is the cognitive system that holds a small amount of information in mind, briefly, in a way that allows you to use it.…
Apr 13, 2026Sleep Deprivation and Cognitive Performance
Williamson and Feyer (2000), in Occupational and Environmental Medicine, ran a deceptively simple experiment: they kept healthy adults awake for 28 hours and tested their…
Apr 8, 2026Mindfulness and Cognitive Performance
Meditation has entered the mainstream cognitive-enhancement market. Corporate wellness programs, military training pipelines, schools, and clinics promote mindfulness as a way to sharpen attention, expand…
Apr 6, 2026Traumatic Brain Injury and Cognition
Every year roughly 69 million people worldwide sustain a traumatic brain injury (TBI), and the question survivors and families ask first is rarely about scans…
Apr 3, 2026People Also Ask
What are sleep deprivation and cognitive performance: what one bad night does to your brain?
In 1999, researchers at the University of New South Wales made a startling discovery: people who had been awake for 17–19 hours performed on cognitive and motor tasks at a level comparable to someone with a blood alcohol concentration of 0.05% — the legal driving limit in many countries. After 24 hours without sleep, impairment reached 0.10% BAC equivalent — legally drunk in every U.S. state. Sleep deprivation doesn't just make you tired; it makes you cognitively impaired in measurable, predictable, and sometimes dangerous ways.
Read more →Mindfulness and Cognitive Performance: Does Meditation Actually Make You Smarter?
Meditation has entered the mainstream. From corporate boardrooms to elementary schools, from military training to clinical therapy, mindfulness practices are promoted as cognitive enhancers that can sharpen attention, boost working memory, and even change brain structure. But beneath the enthusiasm lies a more complex scientific picture. What does rigorous research actually show about meditation's effects on cognitive performance?
Read more →What are traumatic brain injury and intelligence: what happens to cognitive function after a concussion?
Every year, approximately 69 million people worldwide sustain a traumatic brain injury (TBI). While public attention focuses on dramatic cases — athletes who can't remember their careers, soldiers returning from deployment — the vast majority of TBIs are mild concussions sustained in falls, car accidents, and sports. The question that haunts patients and families alike is: will cognitive function recover? The answer depends on severity, age, and a complex interplay of neurological factors.
Read more →What are loneliness and cognitive decline: how social isolation affects the brain?
Humans are fundamentally social creatures. Our brains evolved to navigate complex social hierarchies, maintain relationships, and cooperate in groups. So what happens when these social connections fray? A growing body of neuroscience research reveals that loneliness and social isolation don't just affect mood — they physically alter brain structure, accelerate cognitive decline, and substantially increase the risk of dementia. In an era of increasing social disconnection, these findings carry urgent public health implications.
Read more →How does how did spearman discover the g factor? work in practice?
Spearman's insight came from applying a statistical technique he helped develop — factor analysis — to matrices of correlations between cognitive tests. When people take multiple cognitive assessments, their scores are always positively correlated: someone who excels at vocabulary tends to also perform well on spatial reasoning, arithmetic, and memory tasks. This universal positive correlation is called the positive manifold.
Why is what exactly is g — a brain property or a statistical artifact? important?
This question has fueled decades of debate. The leading perspectives: G as a biological reality: The neural efficiency hypothesis (Haier et al., 1988) proposes that g reflects the overall efficiency of information processing in the brain — the speed and reliability of neural transmission across cortical networks. Neuroimaging studies consistently show that higher g is associated with greater white matter integrity (faster inter-regional communication), more efficient prefrontal cortex activation, and larger total brain volume (r ≈ 0.25–0.40). The parieto-frontal integration theory (P-FIT) identifies a distributed network of brain regions whose connectivity predicts g.
Sharma, P. (2026, April 10). The G Factor: What General Intelligence Means. PsychoLogic. https://www.psychologic.online/g-factor-intelligence/